
作者:格隆汇精译求精翻译组
本文的作者是纽约大学金融系教授Aswath Damodaran,号称“华尔街太傅”,目前在NYU的商学院教授估值课程,是华尔街最热门的教授之一,为华尔街培训了大量的精英。本文作者主要讨论了The Promise and Perils of "Big Data"(“大数据”的前景和风险)。
Each year, for the last 25 years, I have spent the first week playing Moneyball, with financial data. I gather accounting and market data on all publicly traded companies, listed globally, and then try to extract whatever lessons that I can from the data, to use in investing, corporate finance and valuation for the rest of the year. I report the data, classified by industry group and by country, on my website, in the hope that others might find it useful. While, like last year, I will be summarizing what I see in the data in a series of posts over the rest of January, I decided to use this one to both provide some perspective and cautionary notes not only on my data but on numbers, in general.
在过去的25年中,每一年的第一周都是我用金融数据来玩我的“魔球”(Moneyball原意为采用数据分析手段来代替常规的球探经验来辅助决策)时间。我在那一个星期里搜集世界上所有上市公司的财务数据,想看看我能从这些数据里学到什么,以便在这一年里派上用场。我会把研究报告上传到自己的网站上,并且按照国家和行业分类,方便大家参考。我会在这个月接下来的时间里陆续发表一些文章来总结一下我在去年的数据里都学到了什么,总的来说这个系列不仅会给大家提供一些不同的观点和注意事项,还会说说在数据方面都有什么值得注意的地方。
The Number Cruncher's Delusions
数据为王者的错觉
In an earlier post on narrative and numbers, I confessed that I am more naturally a number cruncher than a story teller and that I have learned through experience that focusing entirely on the numbers can lead you astray in valuation and investing. In fact, as you read my posts on what the numbers look like at the start of 2017, it is also worth noting that I am, like all number crunchers, susceptible to three delusions about data:
在之前的一篇讲逻辑和数据的文章里,我坦诚了我自己相对于讲故事更像是一个数据为王的人,同时也承认了完完全全依赖数据确实会在估值和投资上栽跟头。实际上,要是你读了我在今年年初po上来的那篇关于数据到底是什么的文章,你就会发现,其实我算是一个数据为王的人,总是被数据给人的三个错觉所影响:
1. Numbers are precise: I say, only half jokingly, that when a number cruncher is in doubt, his or her reaction is to add more decimals, in the hope that making a number look more precise will make it so. The truth is that numbers are only as precise as the process that delivers them and in business, that makes them imprecise.
1. 数据都是精确的:要我说,(算是玩笑话吧)当一个向来以数字为王的人对数字产生了怀疑的时候,他/她的解决方法多半是在小数点后面多留几位,以期它看起来可靠点。事实是――数据只有在运算过程正确的时候才可靠,在商业里,操作一下运算过程数据就没那么可靠了。
Thus, when you peruse the returns on capital or costs of capital that I will be estimating and reporting for both companies and industry groups, please do recognize that the former is an accounting number, where discretionary choices on expensing and depreciation can translate into big changes in returns on capital, and the latter is market number, making it not only a moving target (as interest rates and risk premiums change) but also a function of my estimation choices as well as estimation error in estimating risk premiums and risk parameters.
因此,你要是想看我评估上传的公司的ROC或者成本之类的数据,那么请注意:前者呢是属于会计数据,也就是说在花销和折旧方面任意选项都会给ROC带来巨大的变化;后者是市场数据,不仅会时时发生变化(主要是因为税率和风险溢价在变化)而且也是在我做评估选择时的变量,同时还是在评估风险溢价和风险参数时的误差。
2. Numbers are objective: One of the resentments that number crunchers have about story tellers is that the latter indulge in flights of fancy and are unashamed about bringing their biases into their stories and through them into pricing and investing. The problem, though, is that numbers can be just as biased as stories, with the caveat that it is easier to hide biases with numbers.
2. 数据都是客观的:数据为王者对于爱讲故事的人的其中一个怨念就是,那些讲故事的总是爱异想天开的把自己的偏见带入到他们想讲的故事里,从而影响了定价和投资。但是问题是,数据也有可能跟故事一样带有偏见性,只不过在数据里面偏见这东西更容易藏身。
To give one example, one of the data sets that I will be updating has tax rates paid by US companies in 2016 and I provide three measures of effective tax rates, ranging from a simple average of effective tax rates across all companies in a sector, yielding the lowest values, to a weighted average effective tax rate that is computed only across money-making firms, which yields much higher values. If you are dead-set on making a case that US companies don't pay their fair share in taxes, you will report only the first number and not mention the rest, whereas if you want to show that US companies pay their fair share and more in taxes, you will go with the latter. It is for this reason that I will not claim to be unbiased (since no one is) but I will try to provide multiple measures of widely used variables and leave it to you to decide which one best fits your preconceptions.
举个例子啊,有一组我打算更新的数据,其中税率这一项是在2016年由美国的公司支付的,那么我提供了三种有效的税率措施,从价值最低的行业内所有公司的平均有效税率到产生更高价值的赚钱的公司的加权平均有效税率。如果你铁了心一定要证明美国的公司们不缴纳他们应该缴纳的税,你的报告里就只用写第一位数,后面的数字提都不要提。反之,如果你想表达美国公司缴的税只多不少,你就把后面的一个不落都写出来。就是因为这个原因我才不会声称自己毫无偏见(又有谁是呢),但是我会尽量给大家提供多一点选择(使用大量不同的变量运算),你们自己来决定哪个最符合自己的预期。
Numbers put you in control: It is human nature to try to be in control and numbers serve us well, in that pursuit. As in other aspects of life, we seem to think that attaching a number to a volatile or uncontrollable variable brings it under control. So, at the risk of stating the obvious, let me say that measuring your return on invested capital is not going to turn bad projects into good ones, just as estimating your interest coverage ratio is not going to make it easier for you to make your interest payments.
3. 数据使你理智:尽可能让自己保持理智是人类的本性,而数据恰好又能很好地满足这个需求。在生活的其他方面,我们常常会将数据和不稳定或无法控制的变量绑在一起来使它稳定。所以,冒着说实话会被打的风险我也要说的是,计算你的ROC并不能把你的垃圾项目变废为宝,计算税率就能轻轻松松让纳税人乖乖交税吗?
Don't get me wrong! I remain, at heart, a number cruncher but I have a more complicated, and healthier, relationship with data than I used to have. My faith in data has been tempered by my experiences with data, and especially so with the ease with which I have seen it bent to reflect the agenda of the user. I trust numbers, but only after I verify them, and I hope that you will do the same with the data that you find on my site.
不要误解我的意思!我内心深处真的还是一个数据为王的人,只不过我现在跟数据的关系比以前更辩证,更客观了。我对数据的信仰在我跟它们打交道的经历中慢慢变得理智了,尤其是在目睹过无数次数据为其使用者低头的例子之后。我相信数据诚不我欺,但是这仅限于我做了该做的尽职调查之后,我希望你也能像我这样对待在我网站上找到的数据。
A Big Data Skeptic
一个大数据怀疑论者
It is my experience with data that make me skeptical about two of the hottest concepts in business, big data and data analytics, at least as a basis for making money. It is true that companies are collecting more data than ever before on almost every aspect of our lives, with the intent of using that data to make more money off us. In a capitalist society, I remain doubtful that big data will be monetized, for three reasons.
在我跟数据打交道的经历中,有两个现在商业里炒得最热的概念最使我怀疑,至少从能不能赚钱的角度来讲啊,就是大数据和数据分析。现在公司们确实比以前更爱收集数据了,基本上涉及到了生活中的方方面面,以期利用数据从我们消费者身上赚更多钱。在资本主义社会,我对大数据是否能盈利持怀疑态度,原因有三。
Data is not information: Not all data is created equal. Data that is based on what you do is worth a lot more than what you say will do; a tweet that you are bullish on Apple, Twitter or the entire market is less useful data than a record of you buying Apple, Twitter or the entire market. This is a point worth remembering as the rush is on to incorporate social media data (from Twitter and Facebook) with financial data to create super data bases.
数据并不是信息:数据不是在同样的情况下生成的。你常常干什么的数据要比你说你将要干什么的数据有价值得多。你发一条看好苹果公司,推特公司或者看好整个市场的推根本毫无用处嘛,这种数据完全不如你有购买苹果公司,推特公司股票记录的数据。这一点我们都要警惕,因为现在这种大数据狂热已经席卷到社交媒体(从推特到脸书),并且已经使用金融数据来生成数据库了。
In addition, as we collect and store more data, it is worth noting that data is not information. In fact, if data analytics does its job, converting data to information will remain its focus, rather than generating neat looking graphs and obscure statistics.
另外,随着我们收集的数据越来越多,值得注意的一点是,数据并不是信息。实际上,如果数据分析师们有好好干活,那么将数据转化成信息才是重点,而不是只生成看上去很简洁的图标或语焉不详的统计资料。
If everyone has it (data), no one has it: For data to have value, you have to some degree of exclusivity in access to that data or a proprietary edge on processing that data. It is one of the reasons that investors have been unable, for the most part, to convert increased access to financial data into investing profits.
如果每个人都有数据的话,那相当于没有:数据之所以有价值,是因为在某种程度上数据有排他性,并不是人人都可以接触到并拥有这些数据的专利。这也是大部分投资者无法将他们接触到的越来越多的数据转化成越来越多的利润的原因之一。
Not all data is actionable: To convert that data to profits, you need to be able to find a way to monetize whatever data edge you have acquired. For companies that offer products and services, this will take the form of modifying existing products/services or coming up with new products/services to what you have learned from the data.
并不是所有数据都能付诸实践:想把数据转换成利润,你得有能力找到你手中的数据所具有的优势。对于提供产品和服务的公司,这意味着他们得优化现有产品/服务或者从数据中获得的灵感来开发新产品/新服务。
As you look at these three factors, it is easy to see why Netflix and Amazon have become illustrative examples for the benefits of big data. They get to observe us (as consumers) in action, Amazon watching what we buy and Netflix observing what we watch on our devices, and that information is not only proprietary but can be used to not only modify product offerings but to also nudge us to act in ways that will be beneficial to the companies. By the same token, you can also see why using big data as an investing advantage will, at best, provide a transitory advantage, and why I feel no qualms about sharing my data.
从上面我说的这三点你也能看出来为什么Netflix和亚马逊能成为将大数据转换成巨额利润的佼佼者。他们观察我们(消费者)的行动,亚马逊观察我们买什么,Netflix观察我们看什么,这些信息不仅是企业独家拥有的,而且还能用来优化产品服务,这就进一步促使我们给公司带来越来越多的利润。同样,你也同样能看到,为什么我说使用大数据来投资最多只能提供一个短暂的优势,以及为什么我愿意毫不犹豫的分享我的数据。
Data Details
数据细节
If you choose to use any of my data, it behooves me to take you through the process by which I collect and analyze the data and offer some cautionary notes along the way.
如果你选择使用我的数据,我觉得有必要带你们走一遍我收集和分析数据的过程,也能给你们提供一些过程中需要注意的事项。
Raw Data: The first step in the process is collecting the raw data and I am deeply thankful to the data services that allow me to do this. I use S&P Capital IQ, Bloomberg and a host of specialized services (Moody's, PRS etc.). For company-specific data, the only criteria that I use for including a company is that it has to have a non-zero market capitalization, yielding a total of 42678 firms on January 1, 2017. The data collected is as of January 1, 2017, with market data (stock prices, market capitalization and interest rates) being as of that data but accounting data reflecting the most recent twelve months (which would be through September 30, 2016 for calendar year companies).
原始数据:第一部就是收集原始数据,我发自肺腑的感谢数据服务系统让我这么做。我使用的是S&P Capital IQ,彭博和一系列专业服务(Moody's,PRS等)。对于公司特定的数据,我筛选公司的唯一标准就是市值不是零,符合的公司有42678家(到2017年1月1日)。同时市场数据(包括股票价格,市值和税率)也是在哪一天收集的,但是会计数据就是近12个月的。
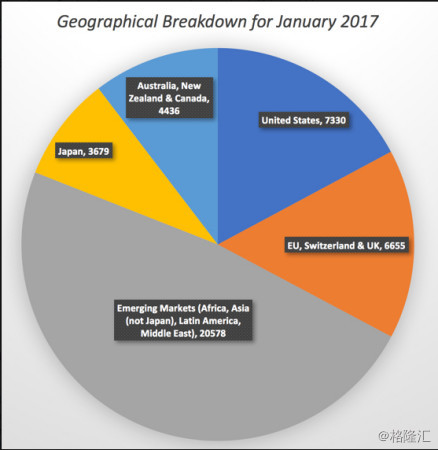
Classification: I classify these companies first by geographic group into five groups - the United States, Japan, Developed Europe (including the EU and Switzerland), Emerging Markets (including Eastern Europe, Asia, Africa and Latin America) and Australia/New Zealand/Canada, a somewhat arbitrary grouping that I am stuck with because of history.
分类:我首先按照地缘信息将这些公司分成了五组――美日西欧(包括欧盟和瑞士),新兴市场(爆哭东欧,亚洲,非洲和拉丁美洲)以及澳大利亚/新西兰/加拿大,这算是一个基于历史原因比较简单粗暴的分组吧。
I also classify firms into 96 industry groups, built loosely on raw service industrial grouping and SIC codes. The number of firms in each industry group, broken down further by geographic grouping.
我还把这些公司分成了96个行业,松散的按照原始服务行业和SIC代码分组。每个行业小组内的公司会进一步根据地缘分组。
Key numbers: I generally don't report much macroeconomic data (interest rates, inflation, GDP growth etc.), since there are much better sources for the data, with my favorite remaining FRED (the Federal Reserve data site in St. Louis). I update equity risk premiums not only for the US but for much of the world at the start of every year and will update them again in July 2017. Using the company data, I report on dozens of metrics at the industry group and geographic levels on profitability, cost of capital, relative risk and valuation ratios.
关键数据:我一般不会提供宏观经济数据(例如税率,通胀,GDP增长啥的),因为这些数据可以在FRED(the Federal Reserve data site in St. Louis)这个网站上找到。我每年年初更新股票风险溢价不仅是为了美利坚,还为了服务世界各地的投资者,下一次更新会在2017年7月。利用这些公司数据,我会上传几十个按照行业分组和地缘分组的指标,主要覆盖盈利,成本,相对风险和一些估值比率。
Computational details: One of the lessons that I have learned from wrestling with the data is that computing even simple statistics requires making choices, which, in turn, can be affected by your biases. Just to provide an example, to compute the PE ratio for US steel companies, I can take a simple average of the PE ratios of companies but that will not only weight tiny companies and very large companies equally but will also eliminate any companies that have negative earnings from my sample (causing bias in my estimates).
计算的细节:在跟数据斗智斗勇的经历中我学到的教训就是,即使计算十分简单的统计资料也得做出选择,这样反过来又会被你个人的偏见所影响。再举个例子,为了计算美国钢铁公司的PE,我本可以直接去这些公司PE的平均值的,但是这样的话不仅将小公司和大公司放在了同一个水平线上衡量,还会直接将一些盈利为负的公司从我的样本中去掉(这就会给估值带来偏见)。
To eliminate this problem, for most of the industry average statistics, I aggregate values across companies and then compute ratios. With the PE ratio for US steel companies, for instance, I aggregate the net income of all steel companies (including money-losing companies) and the market capitalizations for the same companies and then divide the former by the latter to get the PE ratio. Think of these averages then as weighted averages of all companies in each industry group, perhaps explaining why my numbers may be different from those reported by other services.
为了解决这个问题,对于行业平均统计数据,我给所有的公司凑了集值然后才计算的比率。例如,计算美国钢铁公司PE的时候,我把所有钢铁公司的净收入(包括赔钱的公司)加起来,然后再把这些公司的市值加起来,之后用后者除以前者得到PE。把这些均值看做加权平均,也许能解释为啥我给的数据跟别的服务机构给的不一样。


 )
)